shape file data source
Before we get started you need to download a couple of shapefiles that we will use. You can find them here:
- http://www.naturalearthdata.com/downloads/110m-physical-vectors/110m-land/
- http://www.naturalearthdata.com/downloads/110m-cultural-vectors/110m-admin-0-countries/
- http://www.naturalearthdata.com/downloads/110m-cultural-vectors/110m-populated-places/
- http://www.naturalearthdata.com/downloads/110m-physical-vectors/110m-graticules/
Read files with rgdal package
library(rgdal)
library(ggplot2)

# read shapefile
wmap <- readOGR(dsn="ne_110m_land", layer="ne_110m_land")

# convert to dataframe
wmap_df <- fortify(wmap)

# create a blank ggplot theme
theme_opts <-list(theme(panel.grid.minor = element_blank(),
                        panel.grid.major = element_blank(),
                        panel.background = element_blank(),
                        plot.background = element_rect(fill="#97CBFF"),
                        panel.border = element_blank(),
                        axis.line = element_blank(),
                        axis.text.x = element_blank(),
                        axis.text.y = element_blank(),
                        axis.ticks = element_blank(),
                        axis.title.x = element_blank(),
                        axis.title.y = element_blank(),
                        plot.title = element_text(size=22,hjust = .5)))
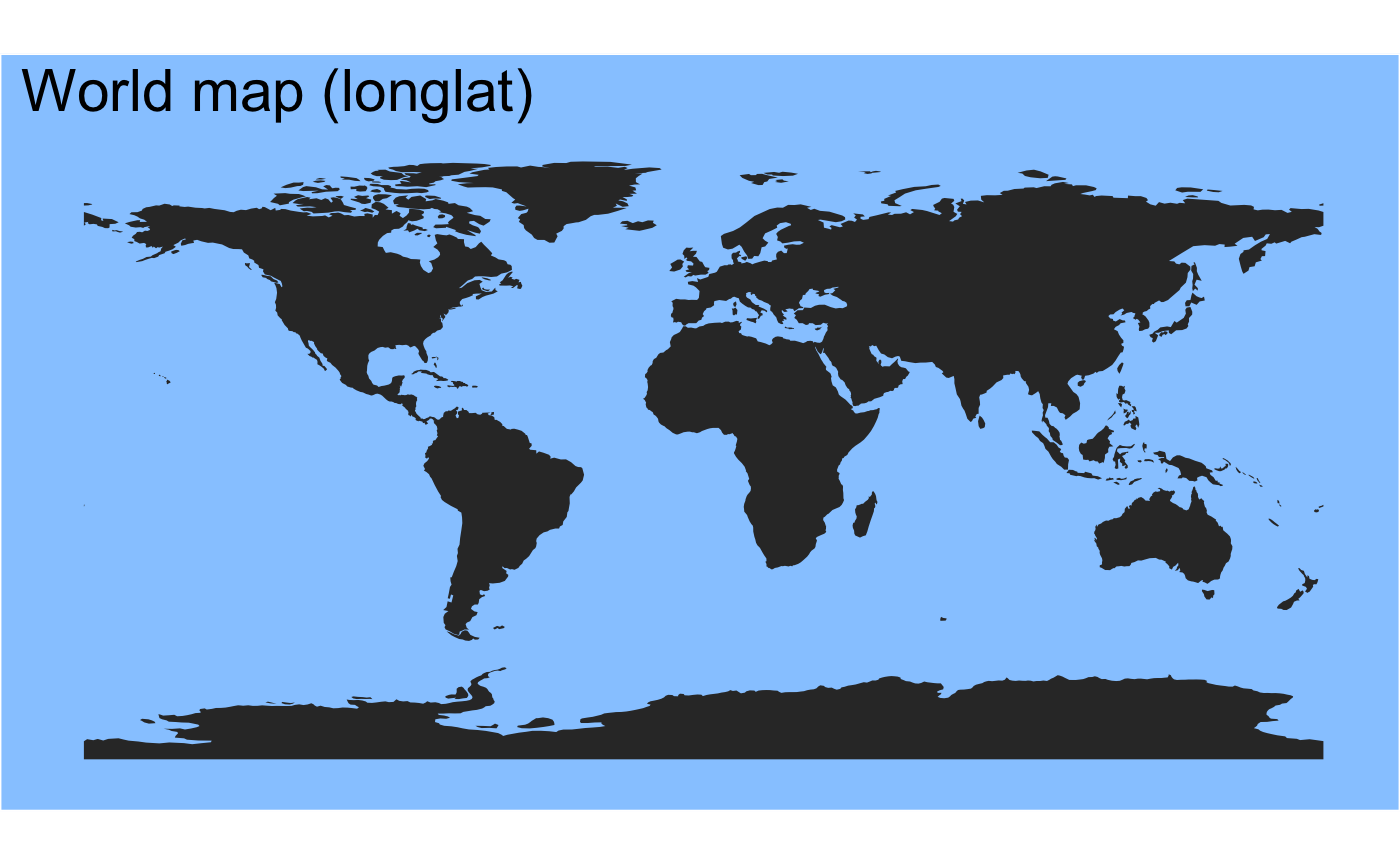
Plot with ggplot2
# plot map
ggplot(wmap_df, aes(long,lat, group=group)) +
  geom_polygon(data = wmap_df, aes(long,lat, group=group)) +
  labs(title="World map (longlat)") +
  coord_equal() +
  theme_opts
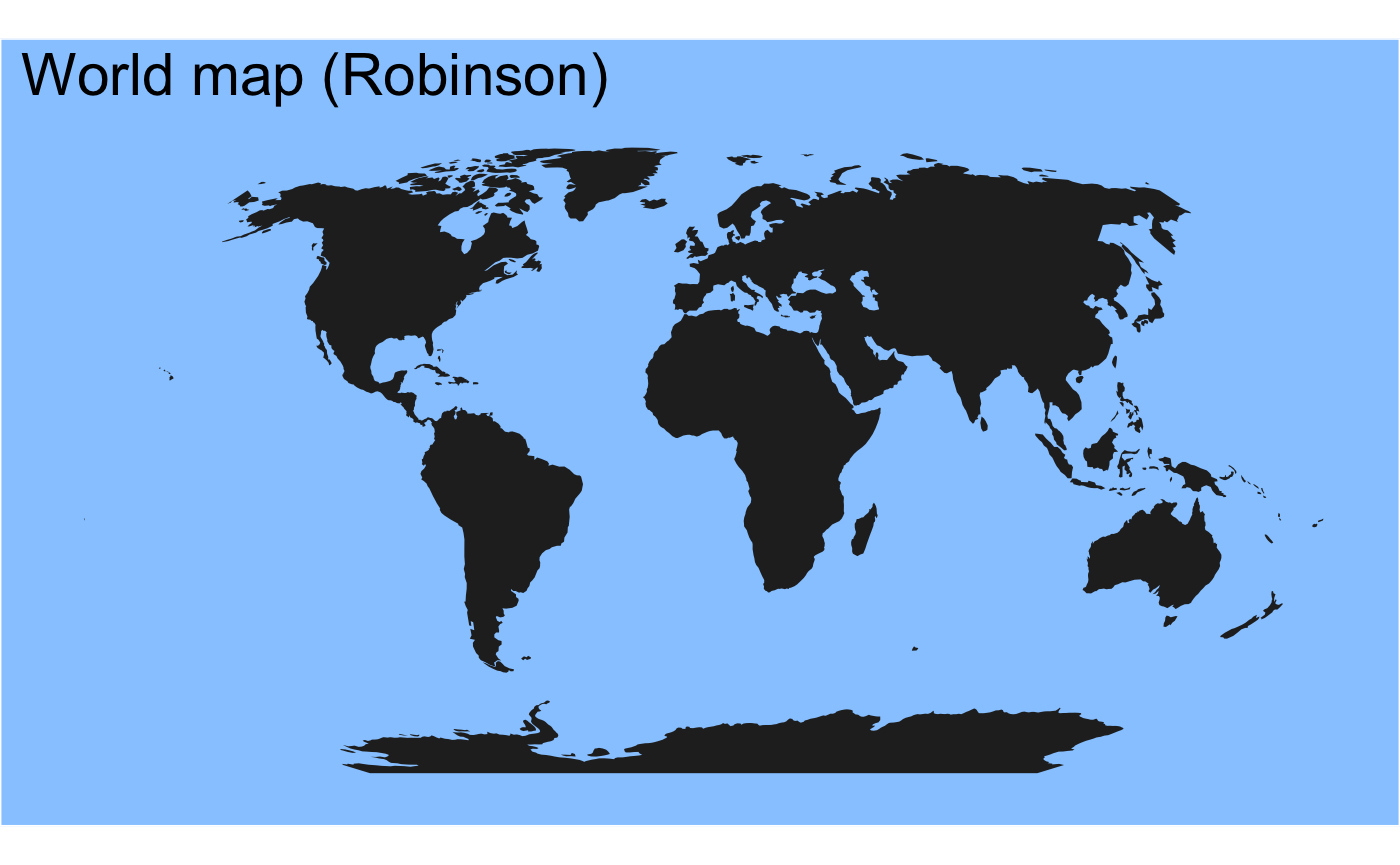
reproject from longlat to robinson
wmap_robin <- spTransform(wmap, CRS("+proj=robin"))
wmap_df_robin <- fortify(wmap_robin)
ggplot(wmap_df_robin, aes(long,lat, group=group)) +
  geom_polygon() +
  labs(title="World map (robinson)") +
  coord_equal() +
  theme_opts

show the hole
ggplot(wmap_df_robin, aes(long,lat, group=group, fill=hole)) +
  geom_polygon() +
  labs(title="World map (Robinson)") +
  coord_equal() +
  theme_opts +
  scale_fill_manual(values=c("#262626", "#97CBFF"), guide="none")
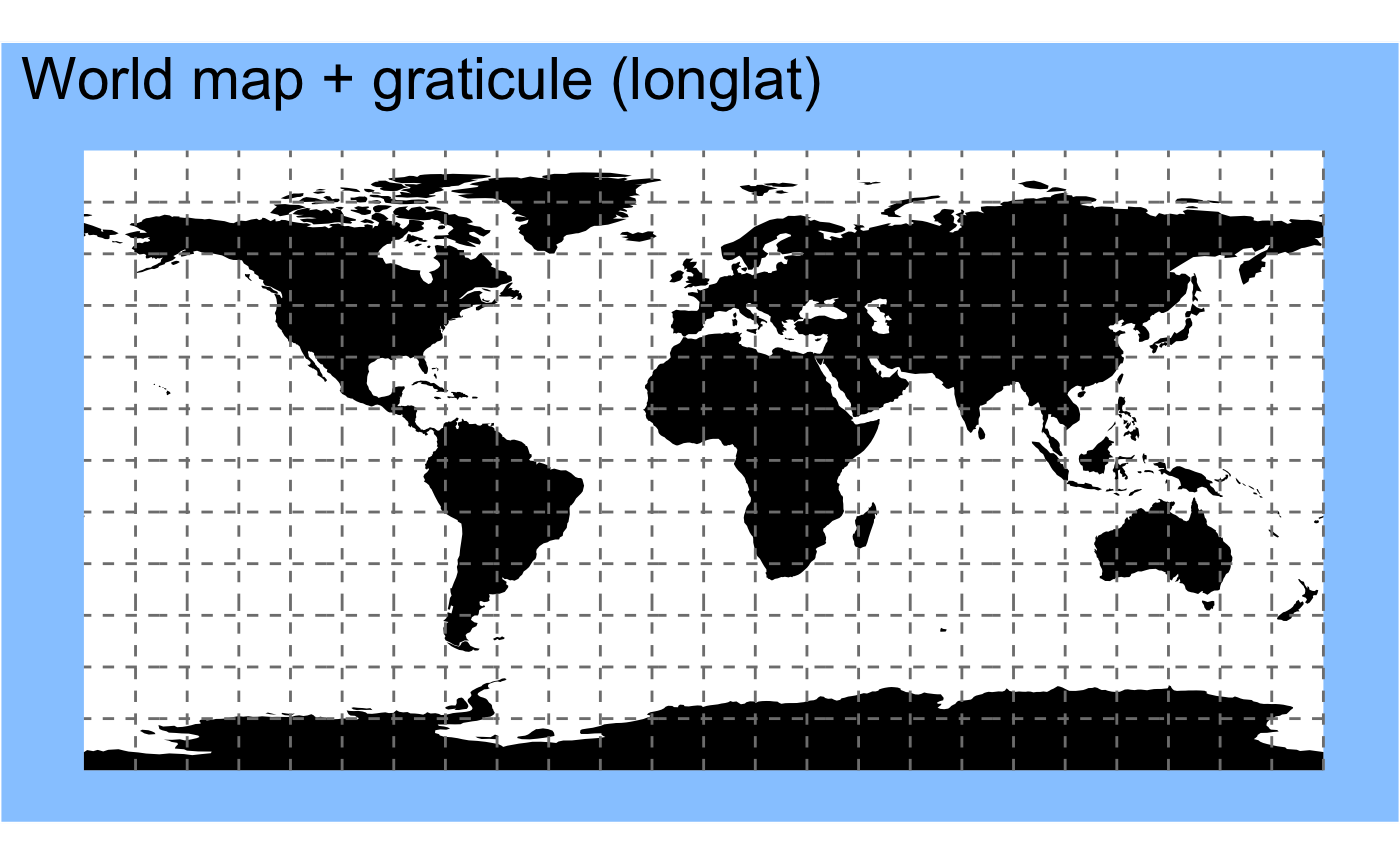
add graticule
# add graticule and bounding box (longlat)
grat <- readOGR("ne_110m_graticules_all", layer="ne_110m_graticules_15")
grat_df <- fortify(grat)

bbox <- readOGR("ne_110m_graticules_all", layer="ne_110m_wgs84_bounding_box")
bbox_df<- fortify(bbox)

ggplot(bbox_df, aes(long,lat, group=group)) +
  geom_polygon(fill="white") +
  geom_polygon(data=wmap_df, aes(long,lat, group=group, fill=hole)) +
  geom_path(data=grat_df, aes(long, lat, group=group, fill=NULL), linetype="dashed", color="grey50") +
  labs(title="World map + graticule (longlat)") +
  coord_equal() +
  theme_opts +
  scale_fill_manual(values=c("black", "white"), guide="none")
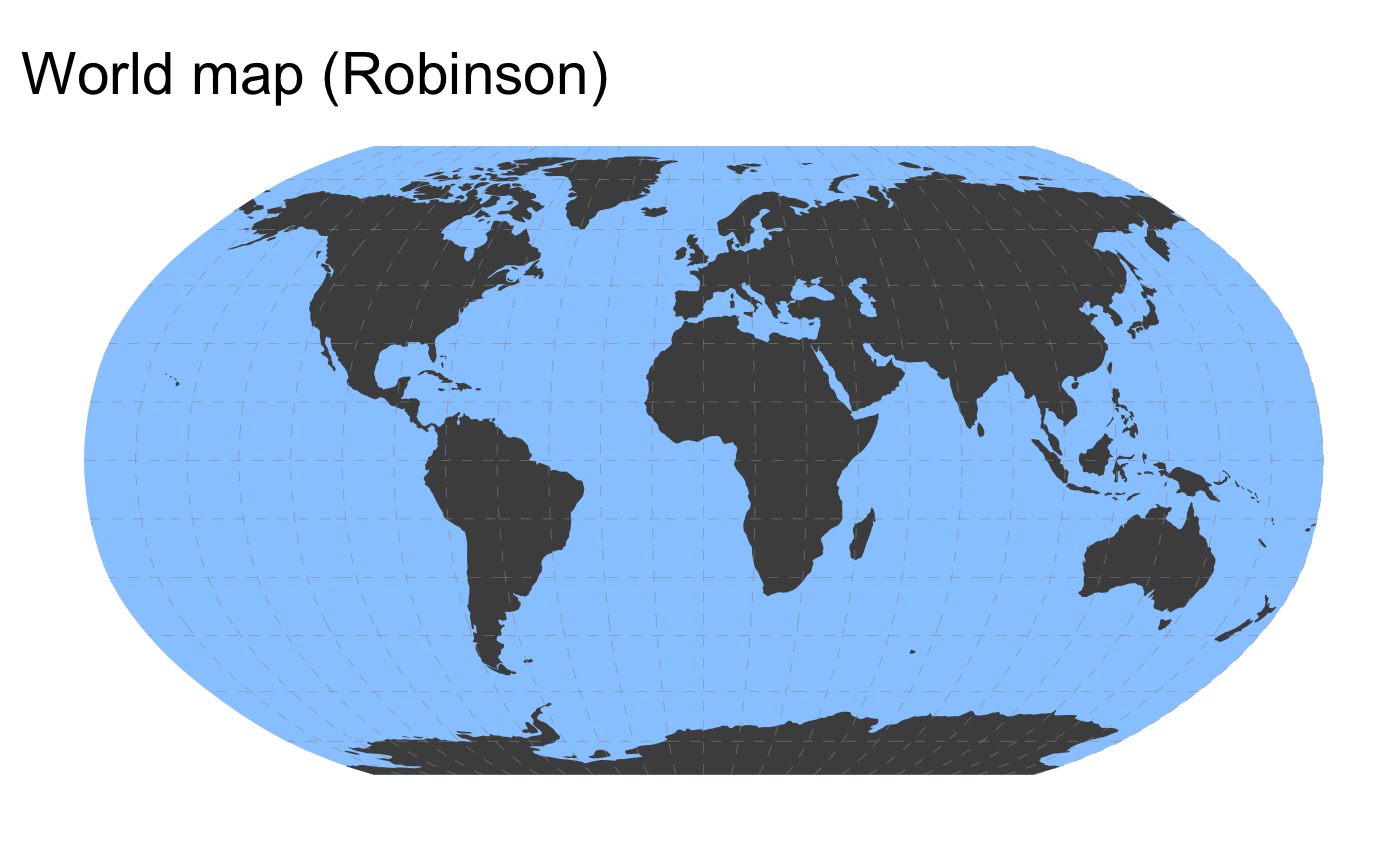
robinson projection with graticule
grat_robin <- spTransform(grat, CRS("+proj=robin"))  # reproject graticule
grat_df_robin <- fortify(grat_robin)
bbox_robin <- spTransform(bbox, CRS("+proj=robin"))  # reproject bounding box
bbox_robin_df <- fortify(bbox_robin)

ggplot(bbox_robin_df, aes(long,lat, group=group)) +
  geom_polygon(fill="#97CBFF") +
  geom_polygon(data=wmap_df_robin, aes(long,lat, group=group, fill=hole)) +
  geom_path(data=grat_df_robin, aes(long, lat, group=group, fill=NULL),
            linetype="dashed", color="grey60",size =.1) +
  labs(title="World map (Robinson)") +
  coord_equal() +
  theme_opts + theme(plot.background = element_blank())+
  scale_fill_manual(values=c("grey30", "#97CBFF"), guide="none")
        # change colors & remove legend
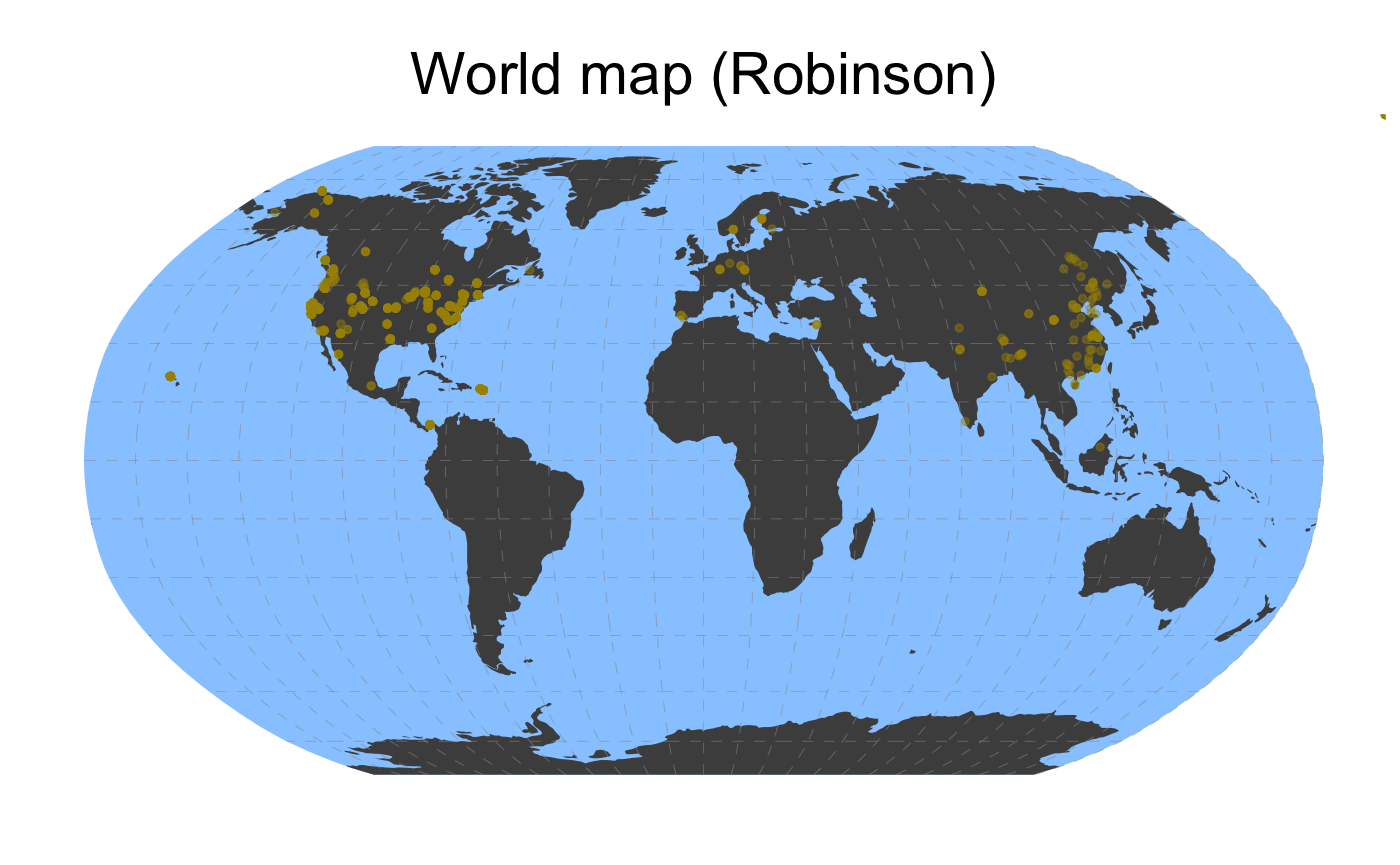
Add points on maps
places_robin_df <- project(cbind(cord.info.df$lon, cord.info.df$lat),
                           proj="+init=ESRI:54030")
places_robin_df <- as.data.frame(places_robin_df)
names(places_robin_df) <- c("LONGITUDE", "LATITUDE")


ggplot(bbox_robin_df, aes(long,lat, group=group)) +
  geom_polygon(fill="#97CBFF") +
  geom_polygon(data=wmap_df_robin, aes(long,lat, group=group, fill=hole)) +
  geom_path(data=grat_df_robin, aes(long, lat, group=group, fill=NULL),
            linetype="dashed", color="grey60",size =.1) +
  labs(title="World map (Robinson)") +
  coord_equal() +
  theme_opts +
  theme(plot.background = element_blank())+
  scale_fill_manual(values=c("grey30", "#97CBFF"), guide="none")+
  geom_point(data=places_robin_df,
                   aes(LONGITUDE, LATITUDE),
                   color=qualitative_hcl(5,alpha = .4,"Dark3")[2],
                   size=1,
                   inherit.aes = FALSE)