Overview
The colorspace package provides a broad toolbox for selecting individual colors or color palettes, manipulating these colors, and employing them in various kinds of visualizations.
- Qualitative: Designed for coding categorical information, i.e., where no particular ordering of categories is available and every color should receive the same perceptual weight. Function: qualitative_hcl().
- Sequential: Designed for coding ordered/numeric information, i.e., where colors go from high to low (or vice versa). Function: sequential_hcl().
- Diverging: Designed for coding numeric information around a central neutral value, i.e., where colors diverge from neutral to two extremes. Function: diverging_hcl().
Installation
install.packages("colorspace")
Choosing HCL-based color palettes
library("colorspace")
hcl_palettes(plot = TRUE)
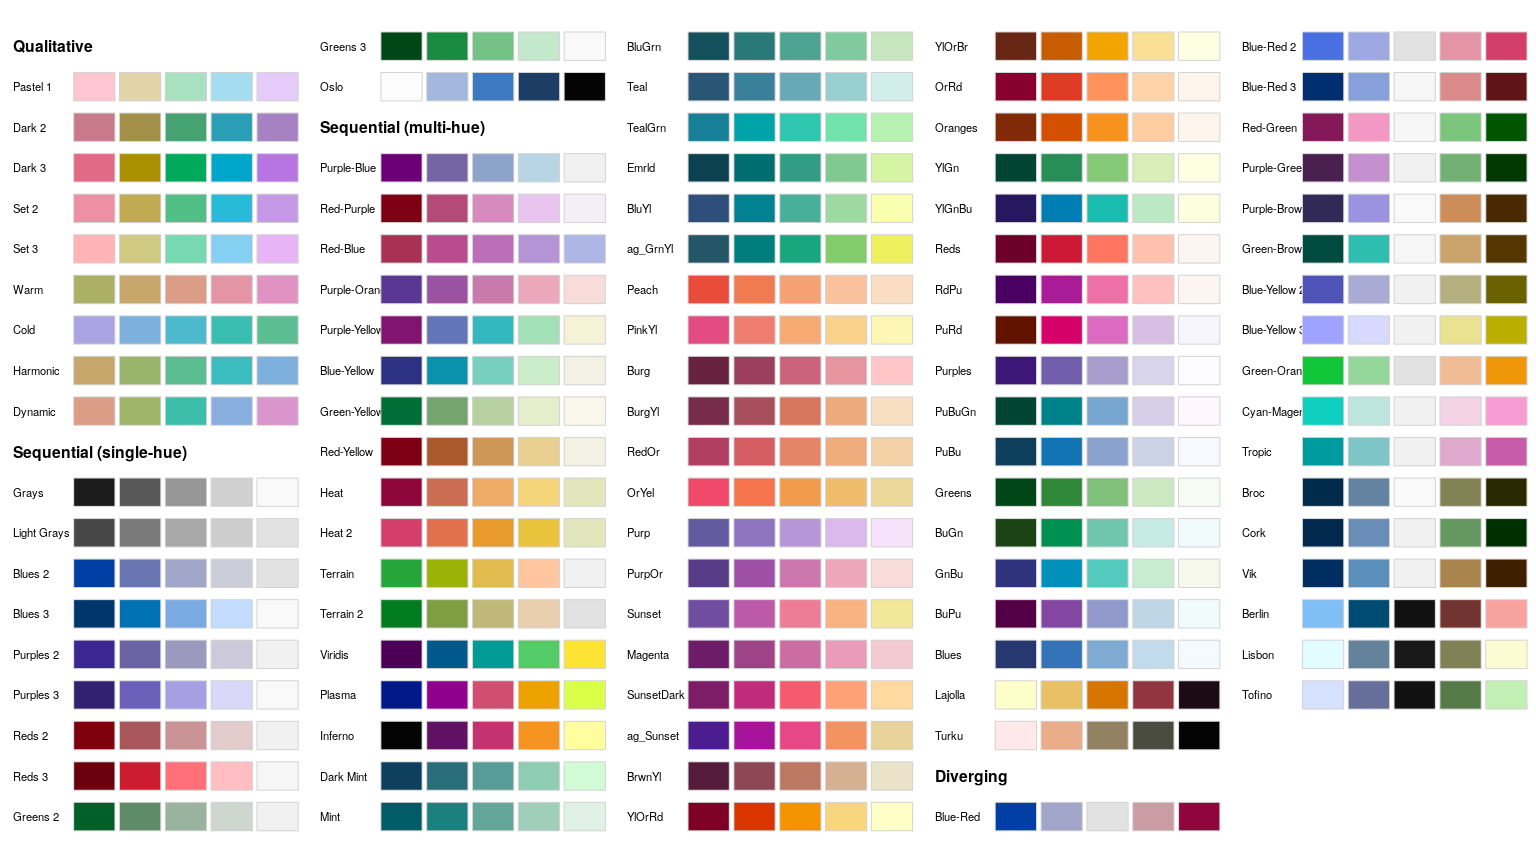
Using the names from the plot above and a desired number of colors in the palette a suitable color vector can be easily computed, e.g.,
q4 <- qualitative_hcl(4, "Dark 3")
q4
The functions sequential_hcl(), and diverging_hcl() work analogously.
Usage with base graphics
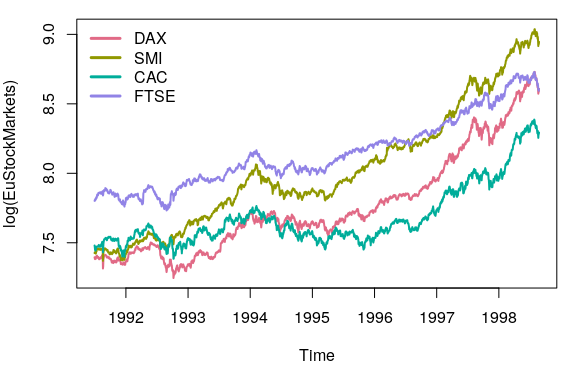
plot(log(EuStockMarkets), plot.type = "single", col = q4, lwd = 2)
legend("topleft", colnames(EuStockMarkets), col = q4, lwd = 3, bty = "n")
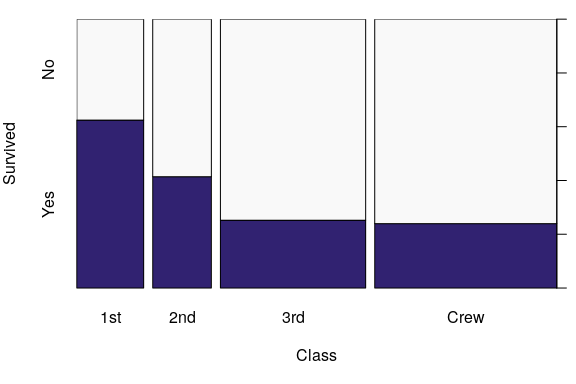
ttnc <- margin.table(Titanic, c(1, 4))[, 2:1]
spineplot(ttnc, col = sequential_hcl(2, "Purples 3"))
Usage with ggplot2
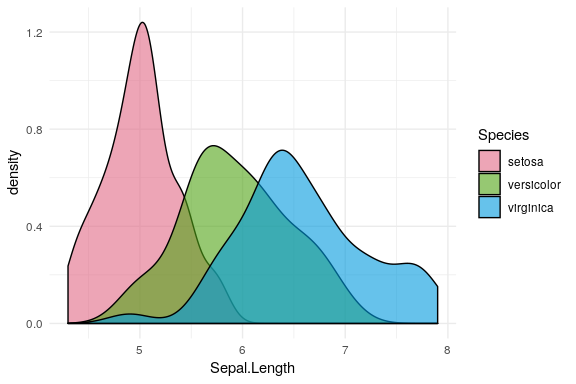
First, semi-transparent shaded densities of the sepal length from the iris data are shown, grouped by species.
library("ggplot2")
ggplot(iris, aes(x = Sepal.Length, fill = Species)) + geom_density(alpha = 0.6) +
  scale_fill_discrete_qualitative(palette = "Dark 3")
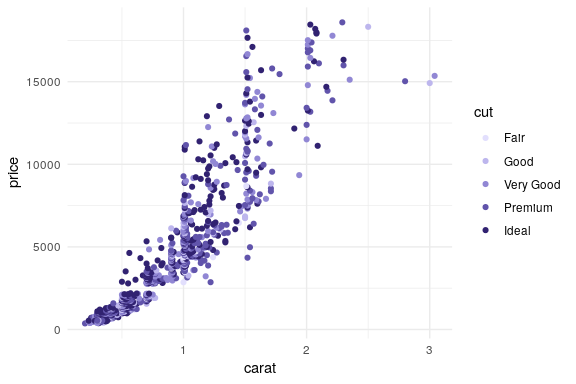
The sequential palette is used to code the cut levels in a scatter of price by carat in the diamonds data (or rather a small subsample thereof). The scale function first generates six colors but then drops the first color because the light gray is too light in this display. (Alternatively, the chroma and luminance parameters could also be tweaked.)
dsamp <- diamonds[1 + 1:1000 * 50, ]
ggplot(dsamp, aes(carat, price, color = cut)) + geom_point() +
  scale_color_discrete_sequential(palette = "Purples 3", nmax = 6, order = 2:6)
Palette visualization and assessment
The colorspace package also provides a number of functions that aid visualization and assessment of its palettes.
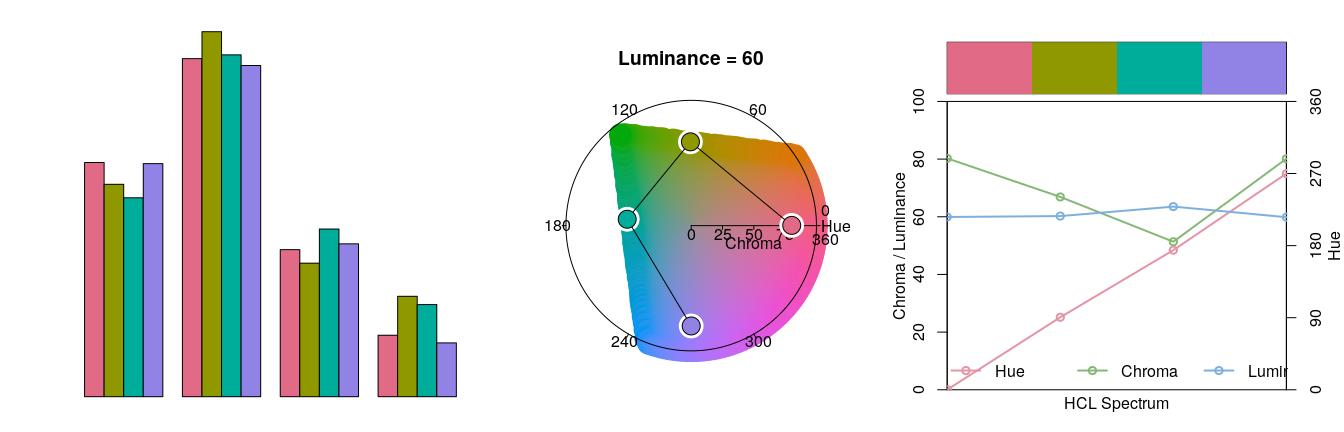
- $demoplot()$ can display a palette (with arbitrary number of colors) in a range of typical and somewhat simplified statistical graphics.
- $hclplot()$ converts the colors of a palette to the corresponding hue/chroma/luminance coordinates and displays them in HCL space with one dimension collapsed. The collapsed dimension is the luminance for qualitative palettes and the hue for sequential/diverging palettes.
- $specplot()$ also converts the colors to hue/chroma/luminance coordinates but draws the resulting spectrum in a line plot. For the qualitative Dark 3 palette from above the following plots can be obtained.
demoplot(q4, "bar")
hclplot(q4)
specplot(q4, type = "o")
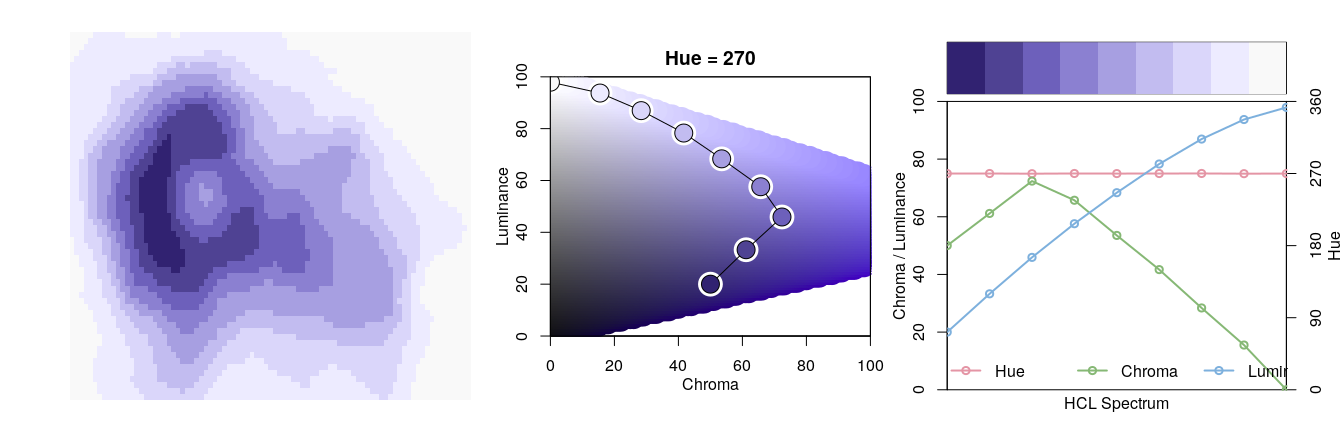
Subsequently, the same assessment is carried out for the sequential Purples 3 palette as employed above.
s9 <- sequential_hcl(9, "Purples 3")
demoplot(s9, "heatmap")
hclplot(s9)
specplot(s9, type = "o")